
It all starts with Data: How to Improve Safety Culture by Solution-Finding
You know by now that effective, sustainable, safety culture improvement is achieved via two complementary components: solution-finding and culture-shaping.
Having laid the foundation with our discussion of culture-shaping, it’s time to roll up our sleeves and get to solution-finding.
Solution-finding involves each step of the DELTA System, which starts with Data. Let’s take a closer look at what we mean by data, what good data looks like, before we move on to step two – Explore.
Overview:
Solution Finding
Solution Finding vs. Problem-Solving
Data and Area For Improvement (AFI)
Avoiding Bias
Data selection checklist
How to select a good AFI and Data
Summary
1. Solution Finding
Solution-finding is the process of recognizing a problem, investigating it, and identifying realistic methods to address it. It is the second of our two elements of continuous improvement.
Solution-finding is a critical step; we need to know what specifically will improve our organizational culture. Just this month, we facilitated a DELTA Workshop that resulted in seventeen high-benefit, low-cost projects, culled from a list of well over one hundred project proposals. The average cost per project was $25. That's not a typo. One-third of the projects were free to implement.
This is the power of focused solution-finding. With just one piece of data and two days, we were able to identify numerous practical, low-cost solutions that will drive meaningful improvements.
2. Solution-Finding vs. Problem-Solving
Organizations are confronted with problems every day. Some of these problems will be novel, but many are the “usual suspects” — those issues that arise time and time again.
Often, when organizations are “problem-solving,” they are actually “symptom-treating.”
Sure, problem solving can provide relief from symptoms and may even improve things for a while, but the underlying condition remains. There’s never any progress: stop treating the symptoms and you’ll find yourself right back where you began.
If problem-solving is a palliative, solution-finding is a cure.
The goal of solution-finding is to reduce the number of problems in an organization by identifying the root cause of a problem — or better yet, the root cause of many problems — and eradicating them. Where problem-solving is putting a brick on your oven rack to level it, solution-finding is buying a new rack (see this post if that made no sense).
The steps to solution-finding are the steps of the DELTA System:
1. Select a piece of Data.
2. Explore context.
3. Locate common themes.
4. Transform causes into solutions.
5. Assess those solutions by their costs and benefits.
Let’s look at how each of these steps contributes to solution-finding.
3. Data and AFI
Starting with data means beginning with the end in mind.
Once the DELTA Workshop is complete and the solutions have been implemented, you’ll need a way to measure progress and determine if you’re on the right track. That’s why Data is the starting point of the DELTA System.
To assess whether our solutions are making an impact, we need at least two measurements. The first measurement is our baseline, the initial metric we are focusing on in the DELTA System. This is taken before any intervention occurs.
The second measurement is the same metric taken after the intervention. The difference between these two values will show the strength and direction of any change.
By repeating this measurement at regular intervals, you can also plot a trendline to track the metric over time. Monitoring this trendline helps contextualize your progress and can provide an early warning for when progress is getting off track.
Example: Let’s say you want to gain weight.
Your pretreatment metric is your current weight. You decide the best intervention is to eat only avocados, and so you eat nothing but avocados for a month. Your posttreatment metric is your weight after a month. These measurements tell you not only if you gained weight (yes/no), but how much weight was gained or lost. This allows us to gauge the effectiveness of the treatment (eating only avocados) on the measure (weight).
As we talk about Data, we use two key terms:
Area for Improvement (AFI), and
Data.
An Area for Improvement (AFI) is the specific organizational problem you want to address.
If you are using our Sociometri platform, your AFI will likely be the factor where your organization scored the lowest. If you don’t have survey data, your AFI should be based on a hypothesis about the root cause of your organization’s challenges.
The AFI helps determine which Data to focus on.
Data refers to a specific metric that provides an objective reference point, giving you a solid foundation for brainstorming and solution-finding. By selecting the right data, you can ensure that your improvement efforts are based on concrete information, not just assumptions.
4. Avoiding Bias
So, you’ve been tasked with choosing which AFI the DELTA Workshop will address. How do you decide which AFI is best to focus on?
When dealing with a large, interconnected system like an organization, it can be difficult to determine where to begin and which issues are most pressing. Because we never have complete information about the entire organization, we often choose something that feels the most critical or relevant to us.
Take Jenny, for example. She is one of two salespeople at her company and often travels for work. It typically takes over a month for her expense reimbursements to be processed, which frustrates her greatly. So, when Jenny is asked to suggest a problem area for an improvement workshop, her immediate response is to fix the slow reimbursement process. Jenny isn’t being selfish — she truly believes this is a major organizational issue. Her personal experience is limiting her perspective, causing her to overlook bigger problems that affect the organization as a whole.
This is called researcher bias, and it’s impossible to eliminate completely. Researcher bias refers to how a researcher’s beliefs and experiences can influence how data is gathered, interpreted, or reported, leading to inaccurate or subjective conclusions. All humans have biases that affect our subjectivity, no matter how objective we strive to be. Luckily, there are ways to mitigate it.1
First, practice reflexivity, which is reflecting on your own beliefs, assumptions, and experiences. By acknowledging your personal biases, you can take conscious steps to minimize their influence.
Next, collaborate with others to elicit different perspectives and identify areas for improvement you might have missed.
Finally, once you’ve selected an AFI, follow this checklist to help identify a suitable piece of Data for use in the DELTA Workshop.
5. Data Selection Checklist
Is it clearly defined?
Can it be measured?
Is there a baseline metric?
Is it a global suspect?
Is it accessible to your participants?
Is it contextualized?
Is it within your organization’s control?
Has your organization committed to resources and implementation?
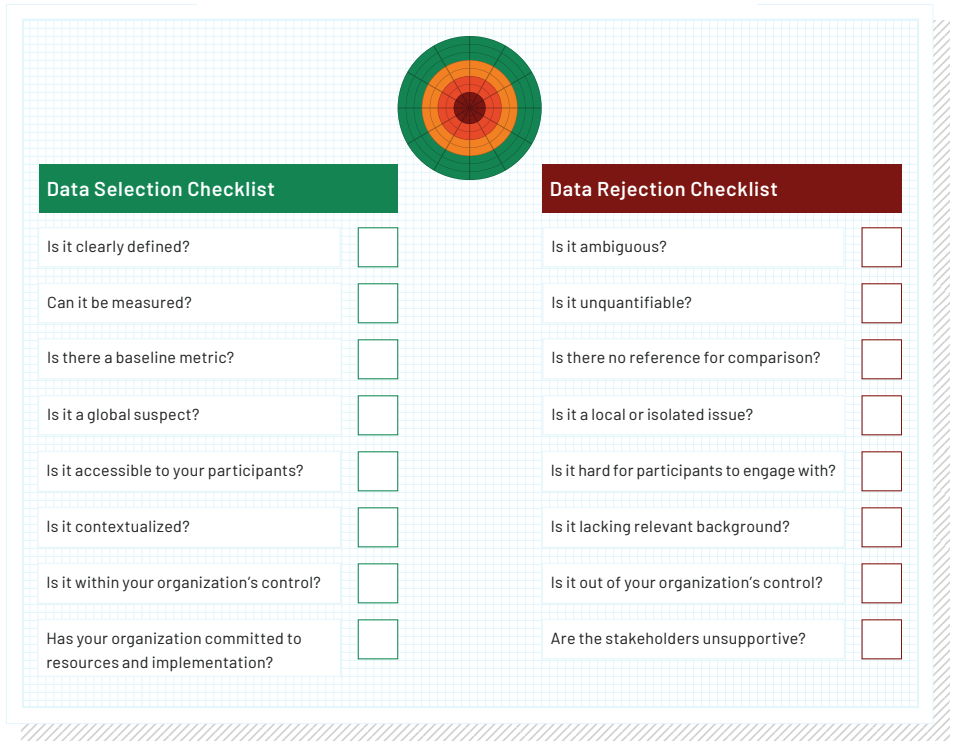
Data is key, but it has to be good. Use this checklist to ensure you are starting with high quality data.
6. Tips for Selecting a Good AFI and Good Data
Is the AFI measurable?
You need to have a clear baseline measurement of the issue before starting the intervention. This “pre-treatment” metric is critical because it will allow you to compare post-treatment results and measure the effectiveness of your solutions. If you aren’t using Sociometri or a validated culture survey, it will be difficult to measure cultural AFIs. You will need to pick an AFI based on the metrics available to you.
Is the AFI a global issue or a local one?
The DELTA System works best when applied to global issues — those that affect the entire organization. A global issue might be, “information-hoarding by departments,” as it affects everyone. A local issue would be, “fixing the coffee machine in the marketing department,” which only impacts a small part of the organization. A narrowly focused issue is unlikely to yield meaningful results. Therefore, your AFI should be something that resonates across teams and departments, impacting the whole organization.
Is the AFI accessible to participants?
The AFI must be something that employees can engage with. Can participants from various levels of the organization speak to the issue, contribute ideas, and suggest practical solutions? We want participants to share their experience and firsthand knowledge, not guess or speculate. An AFI like “inefficient meetings” is something employees at all levels can engage with. They can share their experiences, suggest which meetings are redundant, and propose alternatives. A topic like “Shareholder meetings cause excessive stress among the executive team” is not accessible to most employees, limiting their ability to contribute.
Is the AFI represented by a recent baseline metric?
Our Data needs to be a specific metric which represents the AFI as it is today. For example, if you’re trying to improve employee punctuality, you should have a baseline measurement from the last six months of how many employees arrive late each day. This will allow you to compare the data after implementing changes, such as adjusted start times or incentives for punctuality.
Is the Data clearly defined?
It’s fine for Data to be complex, but it shouldn’t be complicated. Complexity means it is composed of many interconnected parts, while complicated means it contains extraneous parts. For example, “46 percent of employees report work conflicts distract from their jobs” is a complex issue (involving various interconnected parts such as disagreements between colleagues and distraction). A complicated version of the same issue might be something like: “Workplace conflicts, compounded by an inconsistent supply of office snacks and varying room temperatures, distract 46 percent of employees from completing their tasks effectively.” In this example, we've complicated the Data by throwing in extra variables (snacks and room temperatures) which are irrelevant to the main issue under investigation.
Is the Data something your organization can control?
It’s crucial to select a piece of Data that is within the organization’s power to influence. Data tied to external factors, such as reducing delays caused by parts supplier issues, will be difficult to improve upon through internal solutions.
7. Summary
Data is the foundation of the DELTA System, providing a measurable starting point to track progress and determine the effectiveness of the solutions implemented during the workshop.
By carefully selecting an Area for Improvement (AFI) and corresponding Data, you ensure that your improvement efforts are focused on critical, measurable issues.
It’s essential to mitigate bias by reflecting on personal assumptions, collaborating with others to gain a broader perspective, and choosing measurable, global, accessible, and clearly defined data.
Through regular measurements and ongoing evaluations, you can monitor trends and continuously refine your solutions, enabling sustained improvement.
—
The second step in solution-finding is Explore, and it is the first session of the DELTA Workshop. An exciting step, and worthy of it’s own post. Stay tuned.
—
References
Ernest Nagel, “The Value-Oriented Bias of Social Inquiry,” in The Structure of Science: Problems in the Logic of Scientific Explanation (Harcourt, Brace & World, 1961), 484—97.